Survey Response
WALT -
- Write a survey using google forms.
- Use the feedback to create and display that data in a pie graph
- Analyse the results.
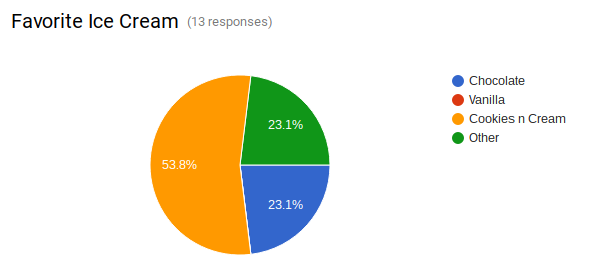
The above data display shows that more than half of the participants choose Cookies n Cream. The same amount of people choose chocolate and other. And that none of them chose vanilla.
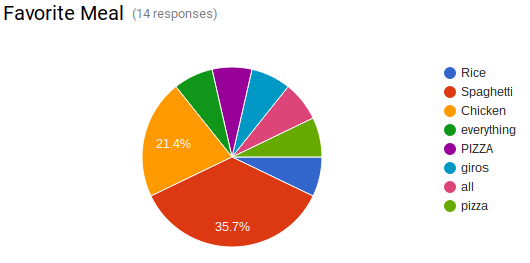
The above data display proves that 5 out of 14 people prefer spaghetti more than chicken and rice. The graph shows that 6 out of 14 of the participants choose to go with different responses.
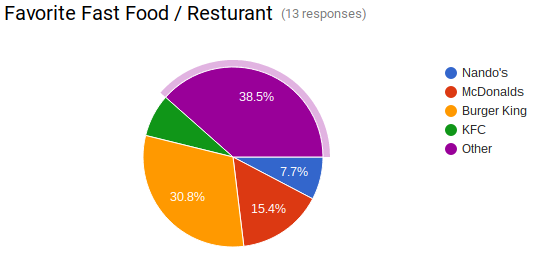
The above data shows 5 out of 13 people choose other. 4 out of 13 people choose Burger King. And the same amount of people choose KFC and Nando’s.
No comments:
Post a Comment